
Friday AM Graphs: Just how biased are NJ’s Growth Percentile Measures (school level)?
New Jersey finally released the data set of its school level growth percentile metrics. I’ve been harping on a few points on this blog this week.
SGP data here: http://education.state.nj.us/pr/database.html
Enrollment data here: http://www.nj.gov/education/data/enr/enr12/stat_doc.htm
First, that the commissioner’s characterization that the growth percentiles necessarily fully take into account student background is a completely bogus and unfounded assertion.
Second, that it is entirely irresponsible and outright reckless that they’ve chosen not even to produce technical reports evaluating this assertion.
Third, that growth percentiles are merely individual student level descriptive metrics that simply have no place in the evaluation of teachers, since they are not designed (by their creator’s acknowledgement) for attribution of responsibility for that student growth.
Fourth, that the Gates MET studies provide absolutely no validation of New Jersey’s choice to use SGP data in the way proposed regulations mandate.
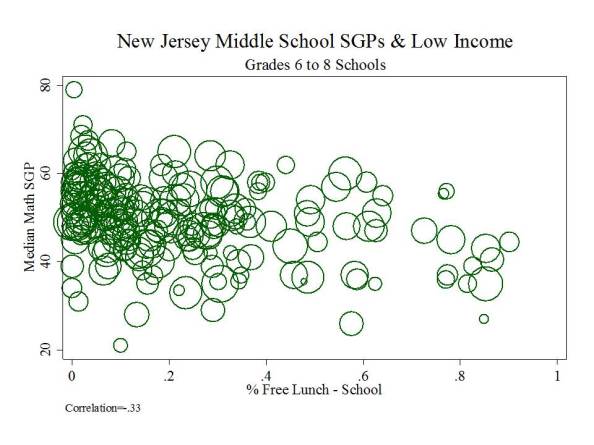
So, this morning I put together four quick graphs of the relationship between school level percent free lunch and median SGPs in language arts and math and school level 7th grade proficiency rates and median SGPs in
SGP data here: http://education.state.nj.us/pr/database.html
Enrollment data here: http://www.nj.gov/education/data/enr/enr12/stat_doc.htm
First, that the commissioner’s characterization that the growth percentiles necessarily fully take into account student background is a completely bogus and unfounded assertion.
Second, that it is entirely irresponsible and outright reckless that they’ve chosen not even to produce technical reports evaluating this assertion.
Third, that growth percentiles are merely individual student level descriptive metrics that simply have no place in the evaluation of teachers, since they are not designed (by their creator’s acknowledgement) for attribution of responsibility for that student growth.
Fourth, that the Gates MET studies provide absolutely no validation of New Jersey’s choice to use SGP data in the way proposed regulations mandate.
So, this morning I put together four quick graphs of the relationship between school level percent free lunch and median SGPs in language arts and math and school level 7th grade proficiency rates and median SGPs in